Page 96 - CCB_Full-Annual-Report-2021
P. 96

96     Notes to the Financial Statements                                                                                                                                                                                            97


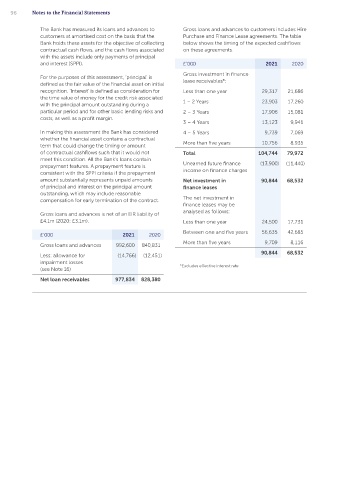
               The Bank has measured its loans and advances to   Gross loans and advances to customers includes Hire               16  Allowance for impairment losses
               customers at amortised cost on the basis that the   Purchase and Finance Lease agreements. The table                   A description of the Bank’s credit risk management and methodology in respect of allowances for impairment
               Bank holds these assets for the objective of collecting   below shows the timing of the expected cashflows             losses is provided below in Note 28. This Note also includes the sensitivity of the Bank’s impairment losses to   Contents
               contractual cash flows, and the cash flows associated   on these agreements.                                           changes in its forward-looking economic scenarios. The tables below set out the Bank’s provisions by IFRS 9
                                                                                                                                                                                                                                          Contents
               with the assets include only payments of principal                                                                     stage as well as a reconciliation of the opening to the closing allowance for impairment losses on loans and
               and interest (SPPI).                              £’000                        2021      2020
                                                                                                                                      advances to customers.
                                                                 Gross investment in finance
               For the purposes of this assessment, ‘principal’ is   lease receivables*:                                              £’000                                           Not credit impaired    Credit impaired
               defined as the fair value of the financial asset on initial
               recognition. ‘Interest’ is defined as consideration for   Less than one year  29,317   21,686                                                                          Stage 1:       Stage 2:      Stage 3:   Total       Strategic Report
               the time value of money for the credit risk associated   1 – 2 Years          23,903   17,260                                                                         subject to    subject to    subject to
               with the principal amount outstanding during a                                                                                                                    12-month ECL     lifetime ECL  lifetime ECL
               particular period and for other basic lending risks and   2 – 3 Years         17,906   15,081                          Real Estate Finance                                2,972         4,489          3,993   11,454
               costs, as well as a profit margin.
                                                                 3 – 4 Years                 13,123    9,941
                                                                                                                                      Asset Finance                                        360           378           259      997
               In making this assessment the Bank has considered   4 – 5 Years                9,739    7,069                          At 31 December 2020                                3,332         4,867         4,252   12,451
               whether the financial asset contains a contractual
               term that could change the timing or amount       More than five years        10,756    8,935                          Real Estate Finance                                2,277         5,793         5,766   13,836
               of contractual cashflows such that it would not   Total                      104,744   79,972
               meet this condition. All the Bank’s loans contain                                                                      Asset Finance                                       559           161            210      930
               prepayment features. A prepayment feature is      Unearned future finance    (13,900)  (11,440)                        At 31 December 2021                                2,836         5,954         5,976   14,766       Corporate Governance Statement
               consistent with the SPPI criteria if the prepayment   income on finance charges
               amount substantially represents unpaid amounts    Net investment in           90,844   68,532
               of principal and interest on the principal amount   finance leases                                                     Impairment provision movement 2021              Stage 1:       Stage 2:      Stage 3:   Total
               outstanding, which may include reasonable                                                                              £’000                                          subject to    subject to    subject to
               compensation for early termination of the contract.  The net investment in                                                                                        12-month ECL     lifetime ECL  lifetime ECL
                                                                 finance leases may be
                                                                 analysed as follows:                                                 Closing Balance at 31 December 2021                2,836         5,954         5,976   14,766
               Gross loans and advances is net of an EIR liability of
               £4.1m (2020: £3.1m).                              Less than one year          24,500   17,731                          Opening Balance at 1 January 2021                  3,332         4,867         4,252   12,451
                                                                 Between one and five years  56,635   42,685                          Increase (decrease) in provision                   (496)         1,087         1,724    2,315
               £’000                        2021     2020
                                                                 More than five years         9,709    8,116                          Increase (decrease) in provision
               Gross loans and advances   992,600  840,831
                                                                                             90,844   68,532                          New loans originated                                942           296             –     1,238
               Less: allowance for        (14,766)  (12,451)                                                                                                                                                                              Independent Auditor’s Report
               impairment losses                                                                                                      Derecognised loans                                  (424)         (448)         (288)   (1,160)
               (see Note 16)                                    *Excludes effective interest rate
                                                                                                                                      Loan commitments                                    148             –             –       148
               Net loan receivables       977,834  828,380
                                                                                                                                      Allowance utilised in respect of write-offs           –            (61)         (840)    (901)
                                                                                                                                      Transfers between Stages and increase in credit risk
                                                                                                                                      – Transfers from Stage 1                            (326)         325              1       –
                                                                                                                                      – Transfers from Stage 2                           1,889        (2,184)          295       –
                                                                                                                                      – Transfers from Stage 3                             56           114           (170)      –

                                                                                                                                      – Increase in credit risk                         (2,781)        3,045         2,726    2,990       Financial Statements
                                                                                                                                                                                         (496)         1,087         1,724    2,315
                                                                                                                                      P&L charge

                                                                                                                                      Increase (decrease) in provision                    (496)        1,087         1,724    2,315
                                                                                                                                      Write-offs                                          104            31          1,343    1,478
                                                                                                                                      P&L impairment charge                              (392)         1,118         3,067    3,793
                                                                                                                                      Income Adjustment*                                    –             –           (267)    (267)

                                                                                                                                      Non customer lending related post write-off recoveries  –           –             (2)      (2)
                                                                                                                                      Total P&L impairment charge                        (392)         1,118         2,798    3,524       Notes to the Financial Statements

                                                                                                                                   *   Interest originally charged on the gross carrying amount for credit impaired stage 3 assets which has subsequently been recalculated on the
                                                                                                                                      net carrying amount. This resulted in a reduced interest income and impairment charge in the income statement of £267k.
   91   92   93   94   95   96   97   98   99   100   101