
Page 18 - 86395_CCB - 2024 Annual Report (web)
P. 18
18
by 135.7% due to the scope of reported All of the Bank’s offices have
emissions, which now includes home maintained their carbon
workers, water and waste. Emissions
from our regional offices reduce during neutral plus status.
the year. The Bank continues to refine its
data collection processes in respect of
scope 3 activities.
During the last year we also
completed a detailed Energy Savings regenerative agriculture, a project located
Opportunity Scheme (ESOS) energy audit in Cumbria, UK, managed by Beyond Zero and
of our energy use and have a number of aligned with Carbon standard UKCCC.
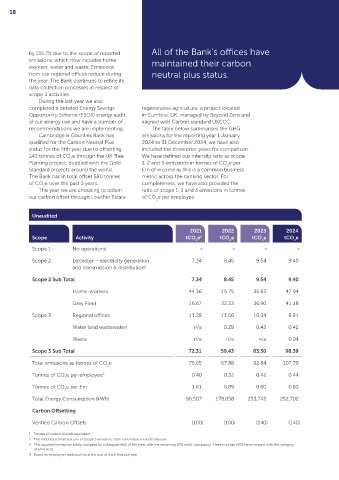
recommendations we are implementing. The table below summarises the GHG
Cambridge & Counties Bank has emissions for the reporting year 1 January
qualified for the Carbon Neutral Plus 2024 to 31 December 2024, we have also
status for the fifth year due to offsetting included the three prior years for comparison.
140 tonnes of CO e through the UK Tree We have defined our intensity ratio as scope
2
Planting project, buddied with the Gold 1, 2 and 3 emissions in tonnes of CO e per
2
Standard projects around the world. £m of income as this is a common business
The Bank has in total offset 580 tonnes metric across the banking sector. For
of CO e over the past 5 years. completeness, we have also provided the
2
This year we are choosing to obtain ratio of scope 1, 2 and 3 emissions in tonnes
our carbon offset through Lowther Estate of CO e per employee.
2
Unaudited
2021 2022 2023 2024
Scope Activity tCO e 1 tCO e tCO e tCO e
2 2 2 2
Scope 1 No operations – – – –
Scope 2 Leicester – electricity generation 7.34 8.45 9.54 9.40
and transmission & distribution 2
Scope 2 Sub Total 7.34 8.45 9.54 9.40
Home‑workers 44.36 15.75 35.63 47.94
Grey Fleet 16.67 32.33 36.90 41.18
Scope 3 Regional offices 11.28 11.06 10.34 8.81
Water (and wastewater) n/a 0.29 0.43 0.42
Waste n/a n/a n/a 0.04
Scope 3 Sub Total 72.31 59.43 83.30 98.39
Total emissions as tonnes of CO e 79.65 67.88 92.84 107.79
2
Tonnes of CO e per employee 3 0.40 0.32 0.42 0.44
2
Tonnes of CO e per £m 1.61 0.89 0.80 0.83
2
Total Energy Consumption (kWh) 96,507 178,058 253,742 252,702
Carbon Offsetting
Verified Carbon Offsets (100) (100) (140) (140)
1 Tonnes of carbon dioxide equivalent
2 This includes a small amount of Scope 3 emissions from transmission and distribution.
3 This assumes homes are solely occupied by colleagues 66% of the time, with the remaining 33% multi‑occupancy. There is a high (50%) error margin with this category
of emissions.
4 Based on employee headcount as at the end of each financial year