
Page 7 - CCB_Annual Report_2022
P. 7
6 Strategic Report 7
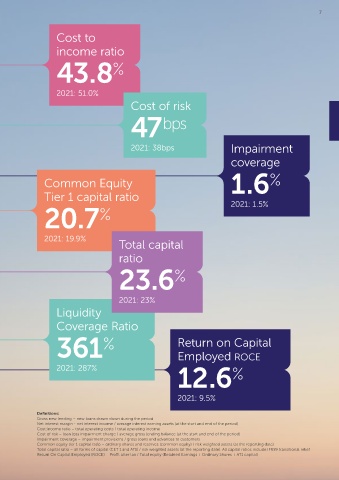
Cost to
Profit before tax income ratio
£ 28.5m 43.8 %
Strategic 2021: £18.5m 2021: 51.0%
Report Cost of risk
47
bps
2021: 38bps Impairment
Summary of Key Performance Metrics coverage
Total Equity
£ 185m Common Equity 1.6 %
Tier 1 capital ratio
Gross lending 2021: £164m 20.7 % 2021: 1.5%
balances
£ 1,055m 2021: 19.9% Total capital
ratio
2021: £993m
Customer deposit 23.6 %
balances
£ 1,103m Liquidity 2021: 23%
2021: £1,026m Coverage Ratio
361 % Return on Capital
Gross new 2021: 287% Employed ROCE
%
Net interest lending 12.6
margin £ 310m 2021: 9.5%
4.5 % Definitions:
Gross new lending – new loans drawn down during the period
2021: £323m
Net interest margin - net interest income / average interest earning assets (at the start and end of the period)
Cost:income ratio – total operating costs / total operating income
2021: 3.8% Cost of risk – loan loss impairment charge / average gross lending balance (at the start and end of the period)
Impairment coverage – impairment provisions / gross loans and advances to customers
Common equity tier 1 capital ratio – ordinary shares and reserves (common equity) / risk weighted assets (at the reporting date)
Total capital ratio – all forms of capital (CET 1 and AT1) / risk weighted assets (at the reporting date). All capital ratios include IFRS9 transitional relief
Return On Capital Employed (ROCE) – Profit after tax / Total equity (Retained Earnings + Ordinary Shares + AT1 capital)