
Page 117 - CCB_Annual Report_2022
P. 117
116 Notes to the Financial Statements 117
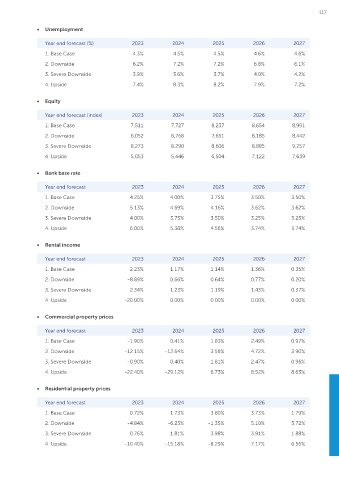
Scenario description: • Unemployment
Year end forecast (%) 2023 2024 2025 2026 2027
Scenario Real Estate Description Asset Finance Description
1. Base Case 4.3% 4.5% 4.5% 4.6% 4.6%
1. Base Case The Bank’s base case scenario The Moody’s base case scenario
forecasts low growth in residential forecasts a strong rebound in demand 2. Downside 6.2% 7.2% 7.2% 6.8% 6.1%
property prices over the next 5 years as the pandemic and geopolitical 3. Severe Downside 3.9% 3.6% 3.7% 4.0% 4.2%
with commercial property prices tensions fade. Global energy prices
falling before recovering back to are expected to decrease. 4. Upside 7.4% 8.3% 8.2% 7.9% 7.2%
current levels over the next 5 years.
2. Downside The Bank’s downside case is The downside case is forecasted • Equity
a simple average of its severe to assume a rise in gas prices
downside and base case scenarios following limited supply to Europe. Year end forecast (index) 2023 2024 2025 2026 2027
The downside also forecasts lack of 1. Base Case 7,511 7,727 8,237 8,654 8,991
stimulation in the UK economy as
household spending is reduced. 2. Downside 6,052 6,768 7,651 8,185 8,442
3. Severe Downside A key input to the Bank’s severe This scenario builds on the downside 3. Severe Downside 8,273 8,290 8,606 8,885 9,257
downside scenario is the Bank case and assumes the UK economy 4. Upside 5,053 5,446 6,504 7,122 7,639
of England’s annual cyclical falls below its pre-pandemic output
scenario published in September levels and economic demand
2022. This is considered to be a collapses, leading to higher • Bank base rate
severe yet plausible scenario. unemployment and lower investment.
Year end forecast 2023 2024 2025 2026 2027
4. Upside The Bank’s upside scenario generally The Moody’s upside scenario reflects
assumes a increase of 5% in residential the forecasts outlined in the base 1. Base Case 4.25% 4.00% 3.75% 3.50% 3.50%
property prices compared to the case scenario, as well as inflationary 2. Downside 5.13% 4.69% 4.16% 3.62% 3.62%
base case with commercial property pressures easing within the UK and
prices 300bp higher than the base Bank of England Base Rate increases 3. Severe Downside 4.00% 3.75% 3.50% 3.25% 3.25%
case across the forecast period. being lower than those forecasted 4. Upside 6.00% 5.38% 4.56% 3.74% 3.74%
in the base case scenario.
• Rental income
Scenario description:
Year end forecast 2023 2024 2025 2026 2027
Weighting Weighting
Scenario Applied 2022 Applied 2021 1. Base Case 2.23% 1.17% 1.14% 1.36% 0.35%
2. Downside -8.89% 0.66% 0.64% 0.77% 0.20%
1. Base Case 47.5% 45%
3. Severe Downside 2.34% 1.23% 1.19% 1.43% 0.37%
2. Downside 32.5% 30%
4. Upside -20.00% 0.00% 0.00% 0.00% 0.00%
3. Severe Downside 15% 12.5%
4. Upside 5% 12.5%
• Commercial property prices
Macroeconomic variable forecasts: Year end forecast 2023 2024 2025 2026 2027
The Bank uses the following macro-economic forecasts in its scenario modelling. The Bank’s Asset Finance 1. Base Case -1.90% 0.41% 1.83% 2.49% 0.97%
scenarios use the GDP, unemployment and equity forecasts, with the Real Estate scenarios applying bank base rate, 2. Downside -12.15% -12.64% 3.58% 4.72% 3.90%
rental income and property price forecasts.
3. Severe Downside -0.90% 0.40% 1.81% 2.47% 0.96%
• GDP
4. Upside -22.40% -29.12% 6.73% 8.52% 8.63%
Year end forecast (£bn) 2023 2024 2025 2026 2027
• Residential property prices
1. Base Case 2,210 2,236 2,267 2,293 2,325
2. Downside 2,074 2,102 2,154 2,179 2,208 Year end forecast 2023 2024 2025 2026 2027
3. Severe Downside 2,270 2,297 2,322 2,349 2,387 1. Base Case 0.72% 1.73% 3.80% 3.73% 1.79%
4. Upside 2,042 2,035 2,106 2,150 2,179 2. Downside -4.84% -6.23% -1.35% 5.10% 3.72%
3. Severe Downside 0.76% 1.81% 3.98% 3.91% 1.88%
4. Upside -10.40% -15.18% -8.29% 7.17% 6.56%